Is there an interesting business opportunity?
Fundamental Analysis
Google and its parent company Alphabet look healthy. Alphabet’s core business is still extremely profitable. The services the company provides are Google (Ads, Chrome, Android, Google Maps, Google Play), YouTube, Cloud and it owns several other companies like FitBit, Waze and Waymo. The company makes money from selling ads (58% of revenue), YouTube ads (10% of revenue) and Cloud subscriptions (10% of revenue). Google has a near-monopoly in search and related advertising in particular, so a strong revenue focus in one direction is fine. Alphabet’s core business is robust and the stock decline (-45%) is not as large as other competitors (Netflix -70%, Facebook -75%).
Alphabet’s problems appear to be in higher costs. All technology companies have grown at a high rate in recent years. In a period of above-average profits and a positive outlook, companies have hired many employees and created additional projects outside their core business. These have mostly not generated profits.
Alphabet’s management is clearly starting to realize this. The company’s CEO, Sundar Pichai, announced to all its employees on January 20, 2023 that the company will lay off 12,000 employees (but has hired over 50,000 in the last 2 years). It will also cut some projects or even cancel them. The first swallow is the termination of Stadia’s service on 18.1.2023. And it probably won’t be the last. Cutting loss-making or low-margin projects and the associated terminations will have a positive effect on the company’s profitability without impacting the revenue of the core business. Profit growth is expected to be less than in recent years. Therefore, the key is to contain costs.
The important news for the company and its stock will be the release of Q4 and full fiscal year 2022 results on February 2, 2023.
Results
The most recently released results are for Q3 2022. Despite the increase in costs, the company is holding profit margins at about 25% for the first three quarters of 2022. Sales have held steady at just under $70 billion for the quarter and were 6% higher than the same quarter in 2021. Revenue comes 46% from the US, 54% from the rest of the world. The ROE is 26.4%, the industry is only 9.5%, so the ROE is higher than normal.
Technical analysis
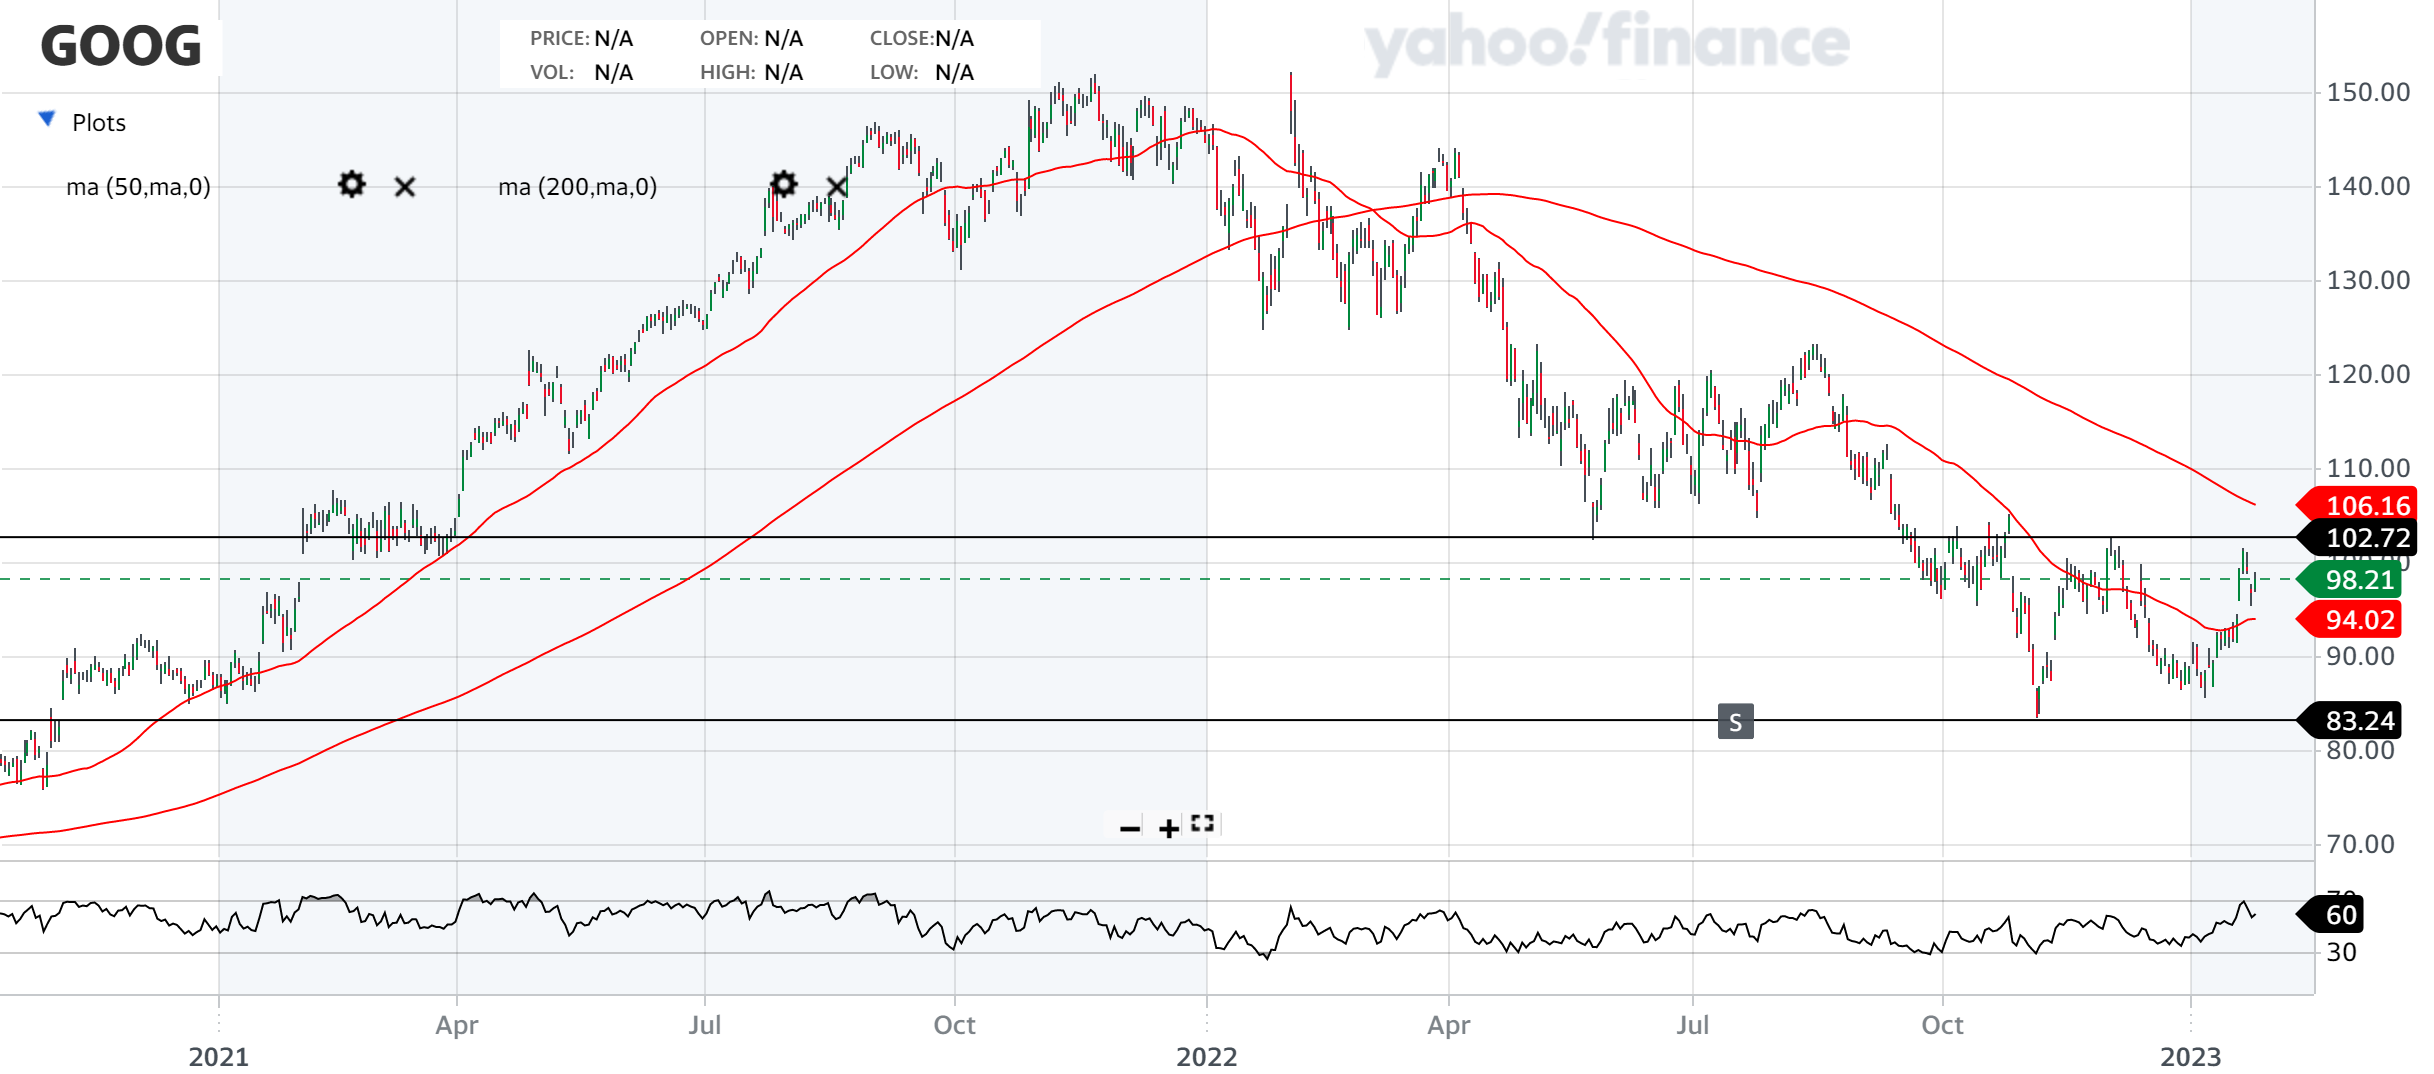
On the daily chart, the 50-day moving average is already below the price, but the 200-day is not yet. The crossover, and therefore a possible reversal of the downtrend, has not yet occurred. The $100 per share threshold also plays a role, it is a strong psychological boundary. The stock has been approaching this price repeatedly since October without breaking it significantly. Resistance at $102 is helping.
The Support and Resistance marked by the $83 and $102 prices are long-term S/R lines and still hold.
The RSI shows us overboughtness in the stock in the short term, with the price even touching the 70 line in the last few days.
Conclusion
From a fundamental standpoint, the stock looks very interesting, the combination of the share price decline and the recent moves by management in trimming expenses give it a positive outlook. On the other hand, the technical