McDonald’s (MCD)
Fundamental analysis
One of the most famous brands in the world, McDonald’s. It was founded by McDonald’s brothers in San Bernardino, California, USA. It came to prominence with its innovative concept of serving food (now named Fast food). They optimized production and production times. With the arrival of Mr. Ray Kroc, the company started opening new stores through franchises.
Today, it is the largest fast food chain in the world, serving food to 69 million customers every day in more than 100 countries.
McDonald’s is not only a restaurant, but also a real estate tycoon. The company owns about 70% of all real estate in which McDonald’s restaurants are located and about 45% of the land on which the properties are located. It then leases these properties and land to franchisees.
In total, MCD has more than 40,000 restaurants.
The company’s turnover is growing slowly but steadily. For 2023, it reached $25 billion with gross profit of $14 billion. Net profit then was $8.4 billion.
The company has become a symbol of globalisation. The Big Mac index is used to compare prices across countries.
Results
In Q1 2024, the company’s sales grew by 2%.
Total sales grew 4% to $6 billion.
The company is growing across markets. US sales grew 2.7%.
Net profit reached $1.929 billion.
Global sales have grown for 13 straight quarters. In total, they have grown by 30% over the last 4 years. However, the company sees consumers’ tendency to cut back.
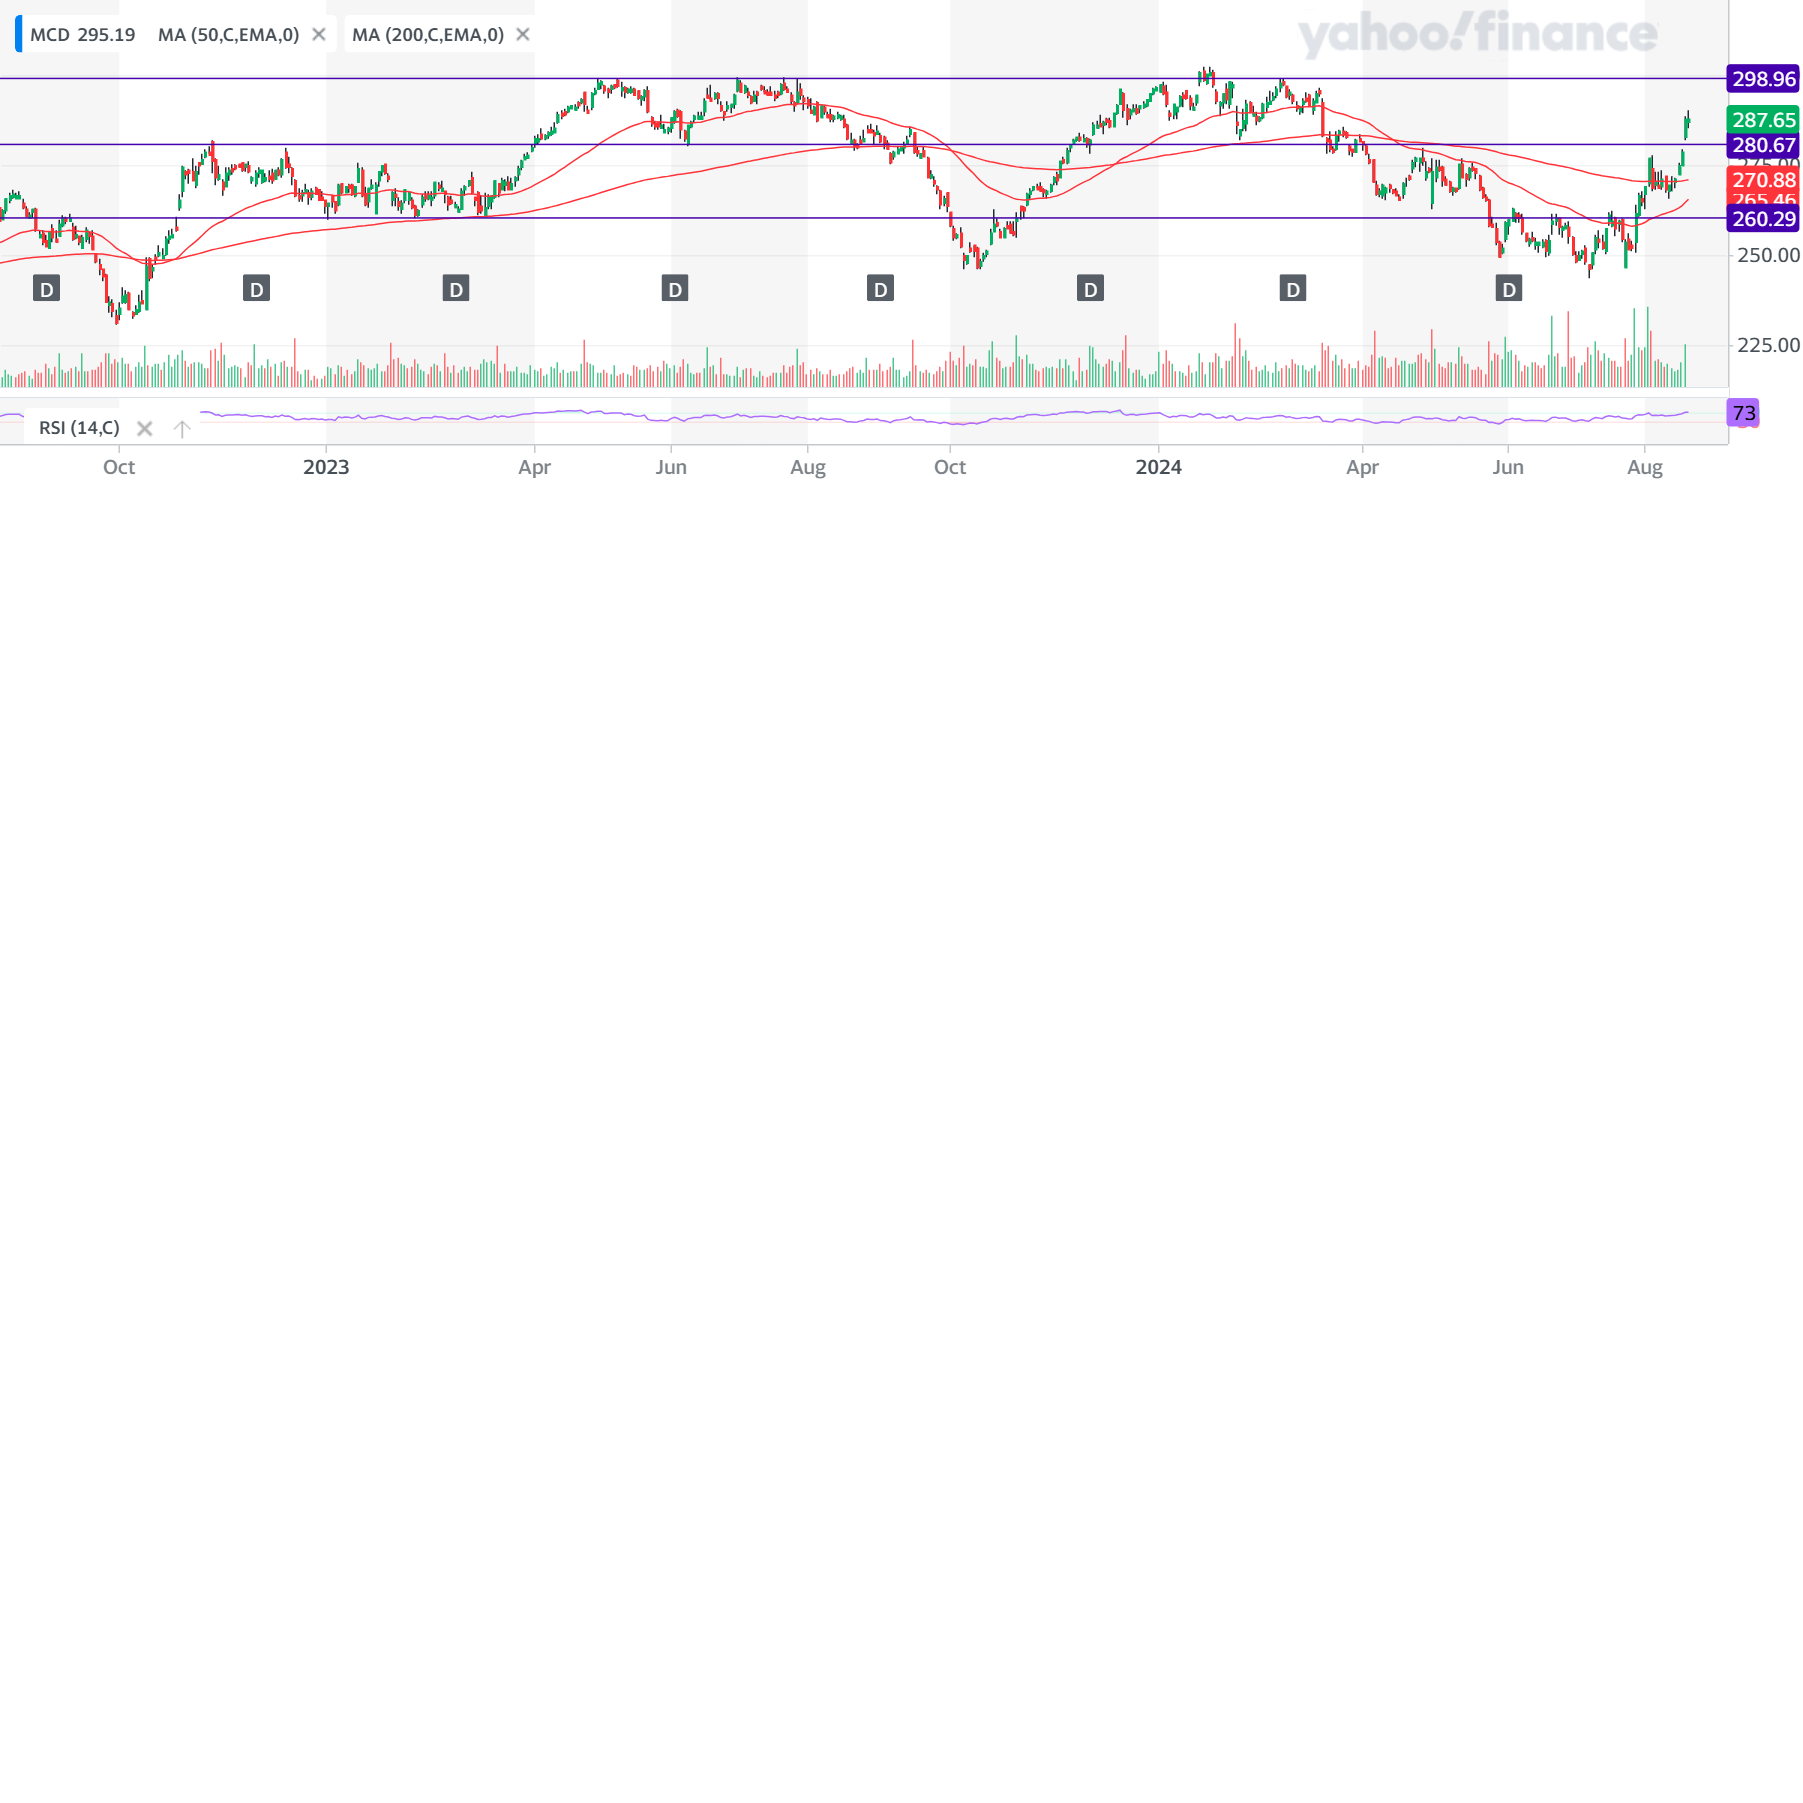
Technical analysis
The stock’s volume is above 1 million shares traded per day.
According to the moving averages, the stock is in a downtrend. However, the spread is narrowing, it is possible that there will be a crossover into an uptrend.
The RSI, on the other hand, shows overboughtness as the stock has shot up in recent sessions.
Currently, the price has broken the resistance at $280 per share. This has historically acted as support as well.
Over the past year, the stock is 2% in the black.
Conclusion
Global notoriety and a profitable business model for a company does not necessarily mean returns for investors. As evidenced by a stock that has only gained 2% for the year thanks to the last few sessions. Current results seem to be good, which investors appreciate. The price has overcome strong resistance at $280 per share.
However, both technical analyses tracked point to a downward trend. Therefore, it is possible that the price will return below the resistance and then the decline may resume.