Asbury Automotive Group – ABG
Asbury Automotive Group is a company operating automotive dealerships across the United States. It is one of the largest companies of its type in the US market. It owns 148 dealerships and operates another 198 through franchising. It sells 31 American, European and Asian brands.
Fundamental analysis
Automobile sales belong to the cyclical stock category. The stock’s behavior is tied to the economic cycle. Automobiles are bought by corporate and private individuals.
As consumer confidence recovers from the COVID19 pandemic, car sales have grown strongly.
In its annual reports, the company lists meaningful allocation of free capital as one of its main objectives, with a focus on growing the company from an investor’s perspective. The company uses its capital as follows:
- Investing money in dealerships it already owns.
- Purchasing additional dealerships that meet the company’s investment criteria
- Repaying debt so that the company maintains its debt holding target
- Returning capital to investors through the repurchase of treasury stock
Results
Asbury Automotive increased its 2022 net income by 87% to $997 million. EPS per share is $44.61.
Sales increase 57% to $15.4 billion.
Online car sales platform Clicklane sold more than 27,500 cars.
The company raises the absolute amount earmarked for repurchasing its own shares to $200 million.
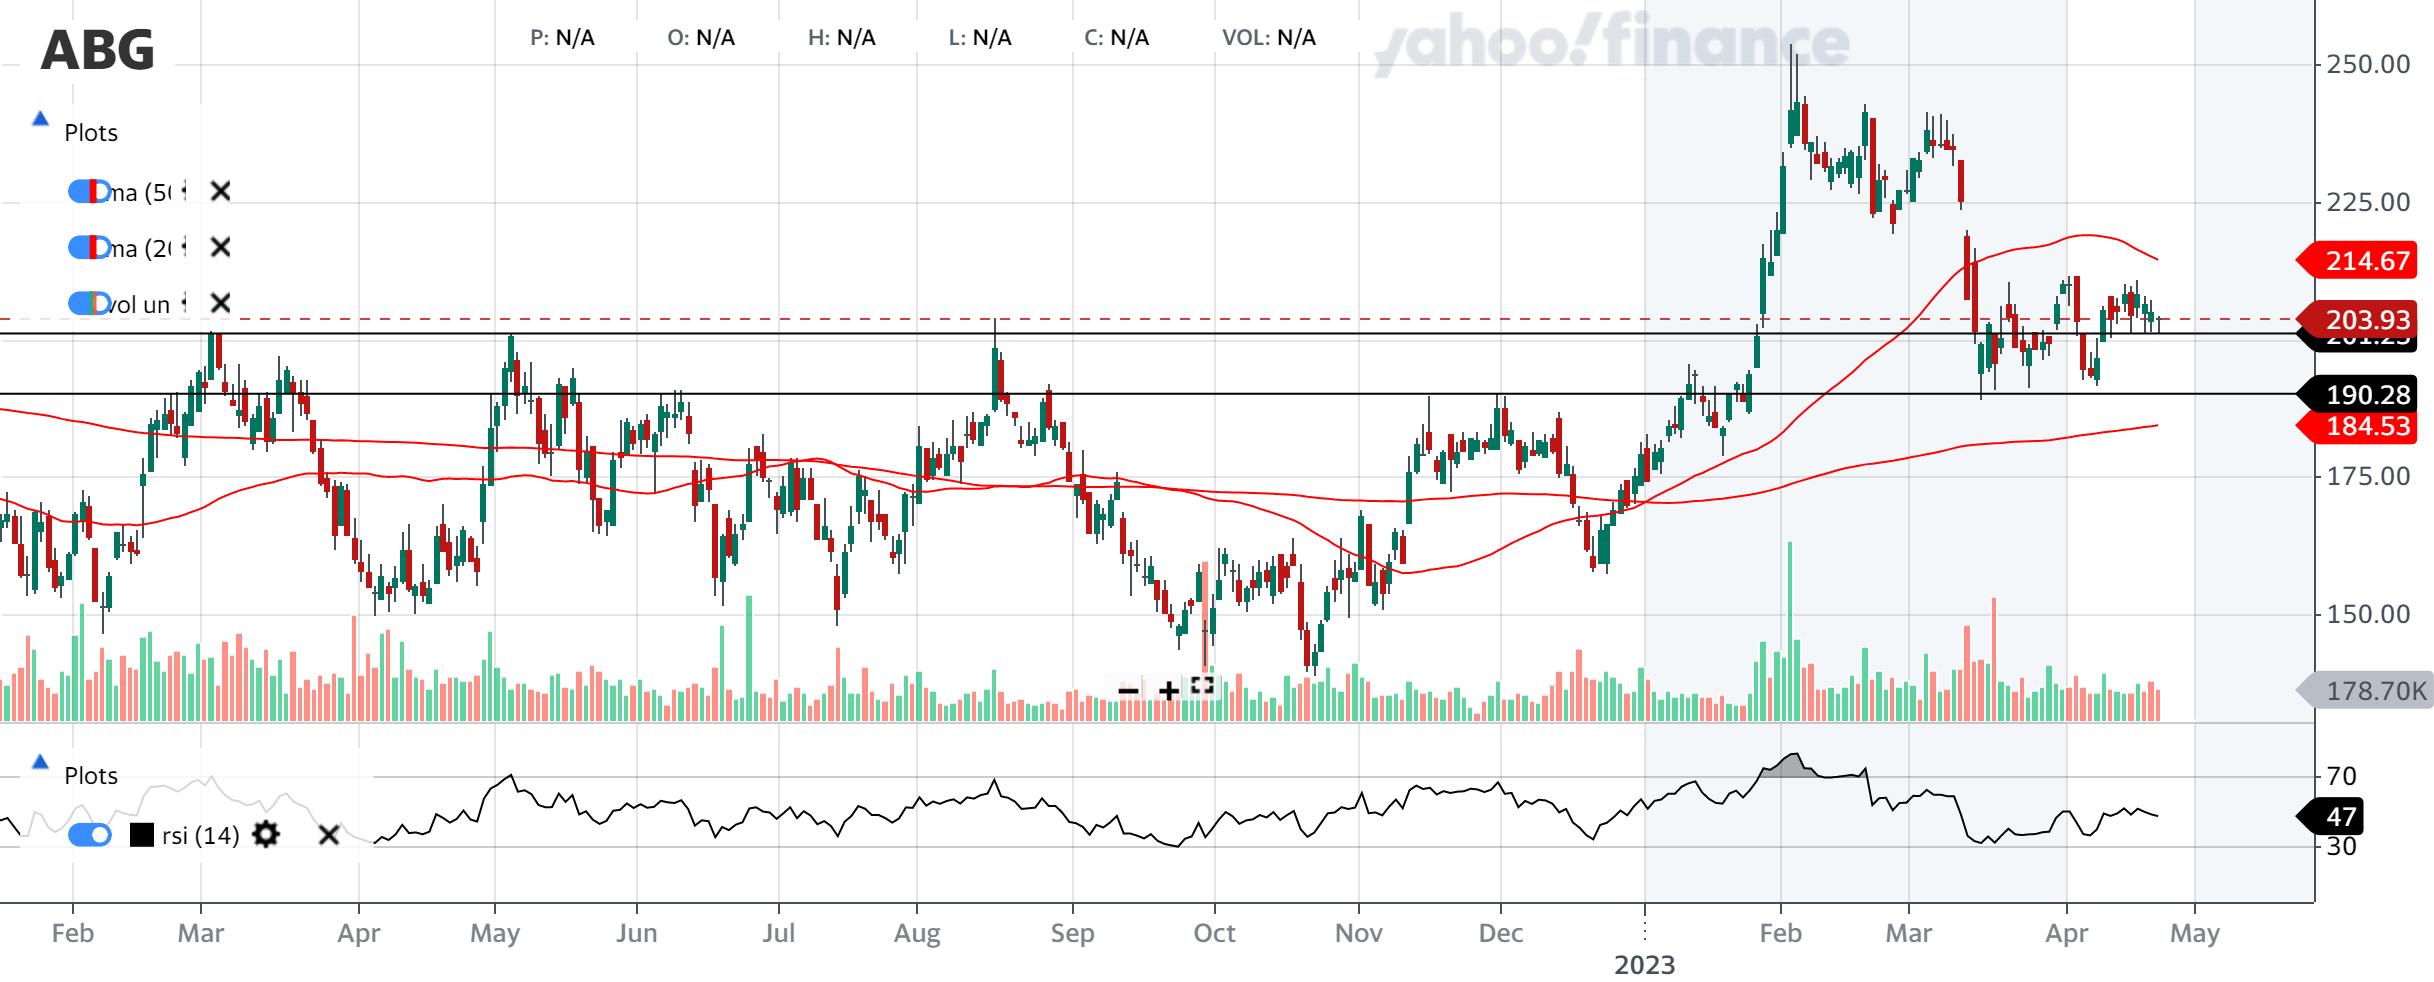
Technical analysis
The company is trading on relatively low volume. The average 200,000 shares per day means the stock has a widespread spread and is more susceptible to sharper market movements, especially if a larger order comes in. On the other hand, if a stock is rising, it can grow solidly for several weeks in a row due to the low volume available.
Currently, according to the moving averages, the stock has been in an uptrend since the beginning of 2023. The massive price increase came with the announcement of the 2022 results. From this value of around $250 per share, the stock has slightly climbed to a price of around $200. Strong support (formerly resistance) is also found here. Together with the next support at $190, this is an interesting situation.
The RSI is in the neutral zone. The buy signal was around mid-March. However, with technical analysis, one should always look at the combination of indicators and the overall market situation. Not just one isolated indicator.
Conclusion
Rarely do we see a company that clearly and publicly defines its goals for investors. Most of the time, these are the company’s goals in the short term. And therefore the remuneration for the Board of Directors and managers linked to them. At Asbury, we see a clear objective to increase its value for investors as well.
If the economic cycle improves, we can expect the company’s stock to rise as car sales increase. However, if the economy slows down and/or problems in supplier-customer relationships persist, the company’s sales may decline, thereby lowering the share price.
According to technical analysis, the stock is at two strong supports. If the supports hold the price, the stock may rise further. If the supports are broken, m