Nordson Corporation – NDSN
Fundamental Analysis
Nordson Corporation is an American multinational corporation (founded 1954) that designs and manufactures dispensing equipment for consumer and industrial adhesives, sealants, coatings and medical fluids. The company also manufactures equipment used in the testing and inspection of electronic components, technology systems for curing and surface treatment processes, as well as medical devices and component technologies.
Results
ISM’s latest analysis on the chemical industry mentions that there may be an improvement in the business situation in the third quarter of 2023.
Nordson is a diversified company focused on three markets: Americas (42% of sales), Europe (25% of sales) and Asia-Pacific (33% of sales). Its products help create or are incorporated into end products such as chips, electronic boards, baby diapers or disposable medical equipment.
The company has a well-diversified product portfolio. It expects sales to grow to $3 billion in 2025 with EBITDA of 30%. In 2022, the company’s turnover was USD 2.59 billion with a net profit of USD 0.5 billion. The company has been increasing its turnover regularly in recent years. It appears to be on track to achieve its turnaround target.
Technical analysis
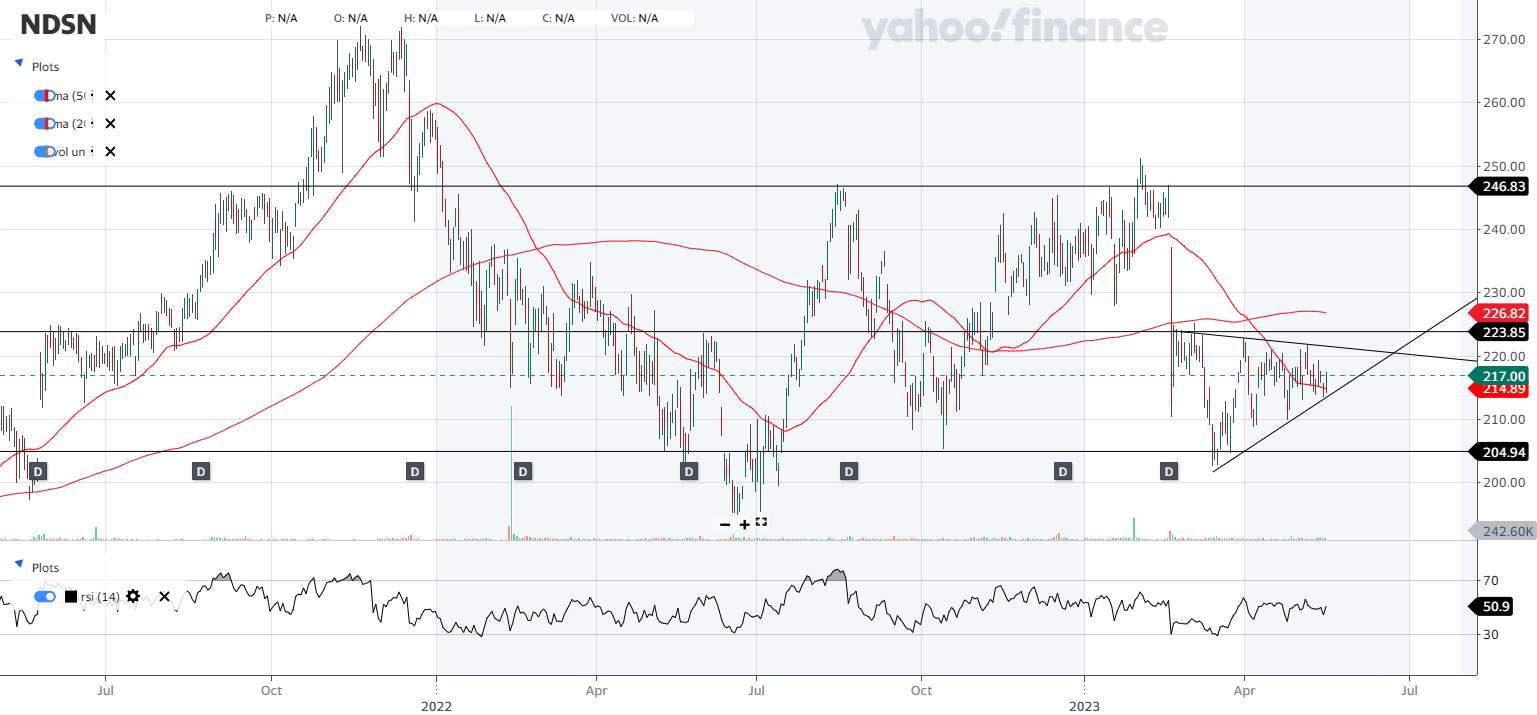
According to the moving averages, the stock is in a downtrend. However, in the context of the historical trend, it is not so clear-cut. In the last two years, the moving averages have crossed four times in total. All of the crossovers have been in the range of $220-235 per share. Overall, the stock is in a trend channel defined by prices of $205-246 per share. The stock’s oscillations in the plus/minus 10% range and the crossings of the moving averages in a narrow band indicate a stable stock value without strong growth or decline. The RSI confirms this hypothesis that the stock is not trending now. The last rise above 70 was in August 2022. That is, almost a year ago.
NDSN is now in an interesting technical setup. The price is in a bullish pennant, and this after a bounce off strong support at $205. Within its price range, the stock has room for a pullback to the trend channel boundary at the $245 price. The rebound from the lower boundary of the channel has already happened twice.
Conclusion
The company has a very well diversified portfolio of products and markets. The company has been growing for a long time and pays a small but steady dividend. The current technical analysis offers an interesting trading opportunity on the D1 chart. The rising breakout triangle is a familiar pattern when speculating on growth.
However, next week (May 23) we have the announcement of the company’s Q2 2023 results. If the results turn out badly, regardless of the technical analysis and its formations, the price may fall. On the other hand, if the results turn out well, the technical formation may even help the stock’s growth.
Sources:
https://investors.nordson.com/financials/default.aspx#annual-reports
https://s24.q4cdn.com/783068429/files/doc_financials/2022/ar/NordsonCorporation2022AnnualReport.pdf
https://s24.q4cdn.com/783068429/files/doc_presentations/